VER’s return on investment 5.1% during 1 Jan–30 June 2024; ten-year average return 5.4%
Published 2024-08-21 at 14:20
INVESTMENT ENVIRONMENT
The first half of 2024 was tranquil for investment markets, despite many uncertainties. While equity market returns were sound, the foreseen changes in central bank interest rate policies curbed returns on fixed income investments. By contrast, in August, after the end of the reporting period, market volatility was strong.
During the first half of the year, the markets were mainly driven by central bank interest rate policies. Although inflation abated during the first part of the year, the trend was not universal, which affected the expectations regarding more relaxed central bank policies. By June, the inflation rate in the euro area fell to 2.5 per cent, close to the European Central Bank's target of 2 per cent. The easing of monetary policy was delayed in the first half of the year.
Economic and corporate earnings growth were slack during the first six months of 2024. However, positive expectations for 2025 and 2026 have kept the equity markets buoyant. The increase in stock prices during the first half of the year reached a level equivalent to sound annual returns. In the United States, the market was driven by technology stocks, largely due to the excellent performance of Nvidia and hefty returns in the rest of the technology sector.
Geopolitical tensions persist. The conflict in Ukraine, the war in Gaza and the tense situation in Taiwan have all strained relations between the major powers, creating uncertainty about the future. Step by step, geopolitics is exerting pressure on companies to take the changed situation into account in their business operations. Geopolitical tensions are also reflected in the huge gap in performance between the US and Chinese stock markets. China has been shunned by investors for some years now, although early 2024 offered some relief in the country. The primary reason for this poor performance is the Chinese real estate sector, which has been beset by problems up to the present day. Here, too, geopolitics have played a part by introducing new uncertainties as investors assess the broader implications for the years ahead.
The first half of 2024 was driven by listed equities and the healthy returns they generated. Returns in the fixed income market have been reasonable, although variable. Several high-risk fixed income products have offered sound returns, whereas government bond yields have been weak. Transaction volumes in illiquid investment markets have been subdued, keeping returns moderate. While this is due to a number of reasons, one explanation is the relatively high interest rates.
VER’S RETURN ON INVESTMENTS
Future monitoring and evaluation of the VER’s investment activities will focus on long-term outcomes and future prospects instead of quarterly reporting. However, VER will continue to post quarterly figures and comments.
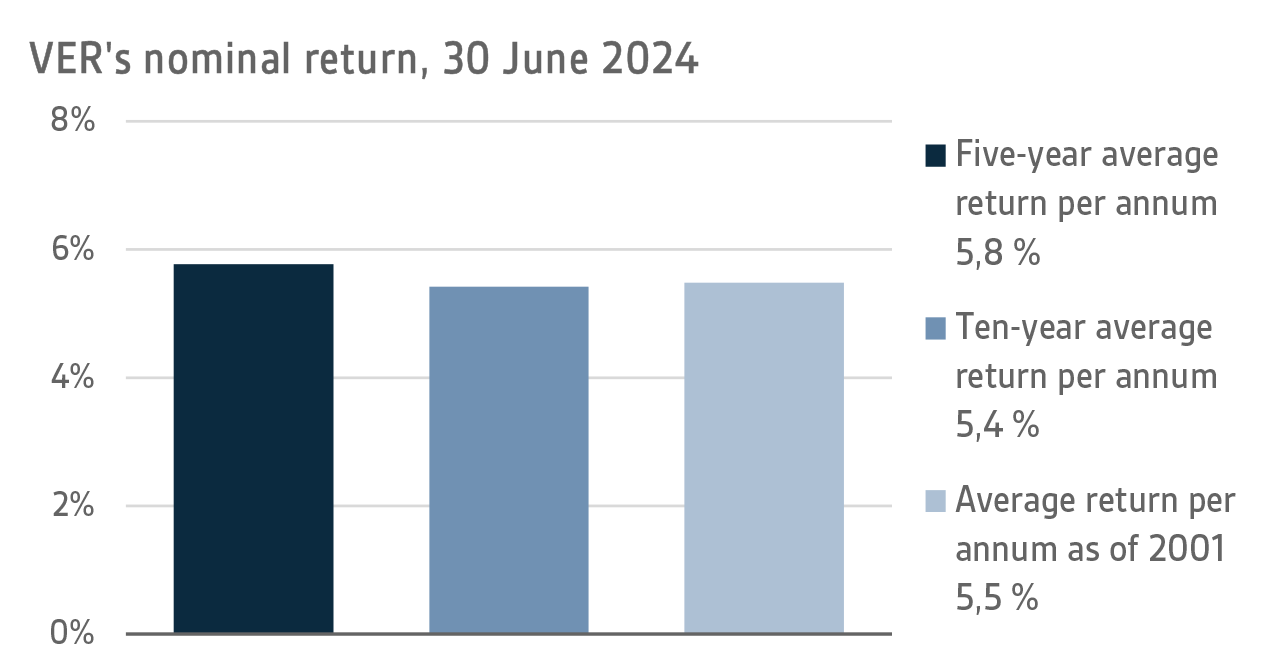
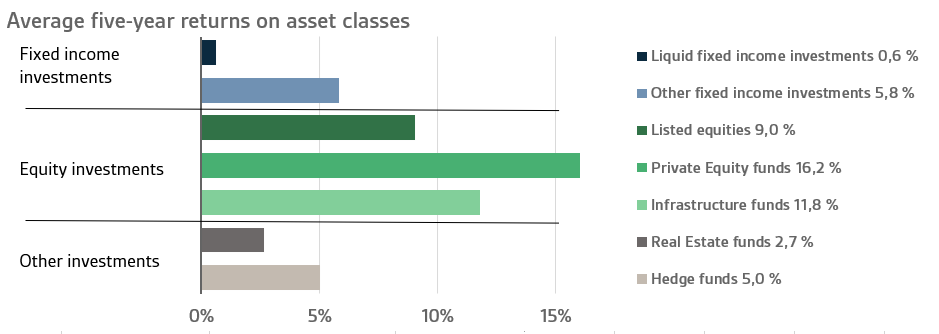
On 30 June 2024, VER’s investment assets totalled EUR 23.6 billion. During the first half of the year, the return on investments at fair values was 5.1 per cent. The average nominal rate of return over the past five years (1 July 2019–30 June 2024) was 5.8 per cent and the annual ten-year return 5.4 per cent. Since 2001 when VER’s activities assumed their current form, the average rate of return has been 5.5 per cent.
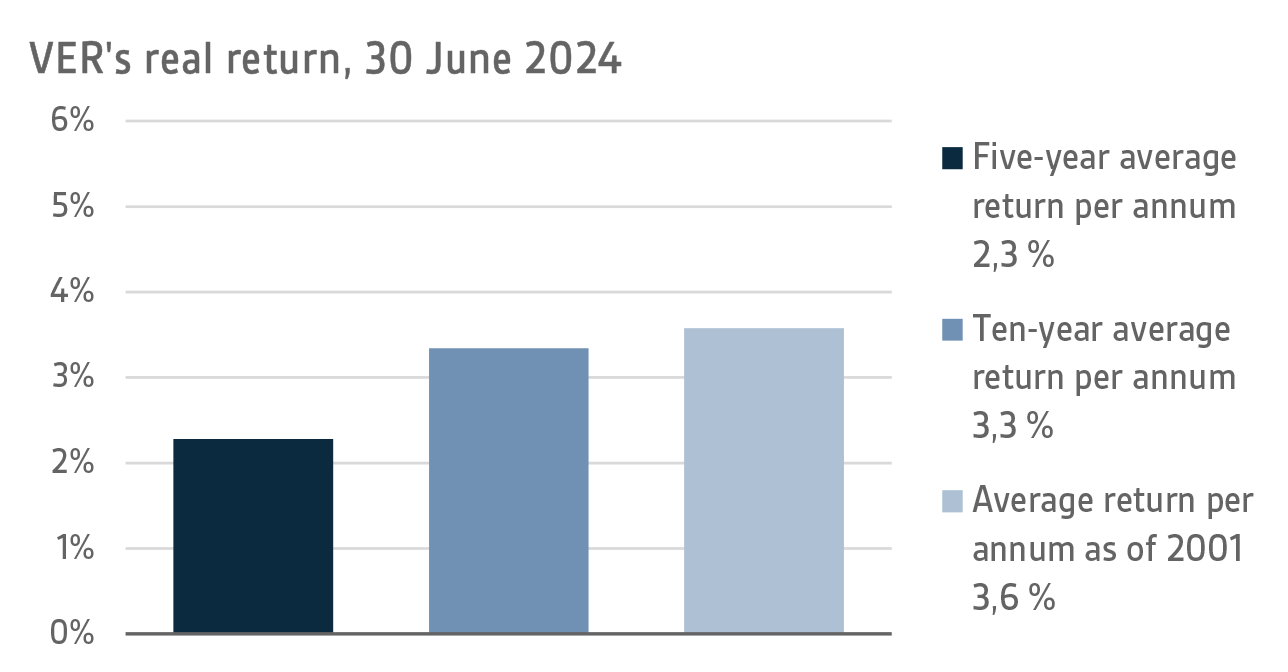
The real rate of return during the first half of 2024 was 4.5 per cent. VER’s five-year average real return was 2.3 per cent and ten-year real return 3.3 per cent. Since 2001, when VER’s activities assumed their current form, the average real rate of return has been 3.6 per cent.
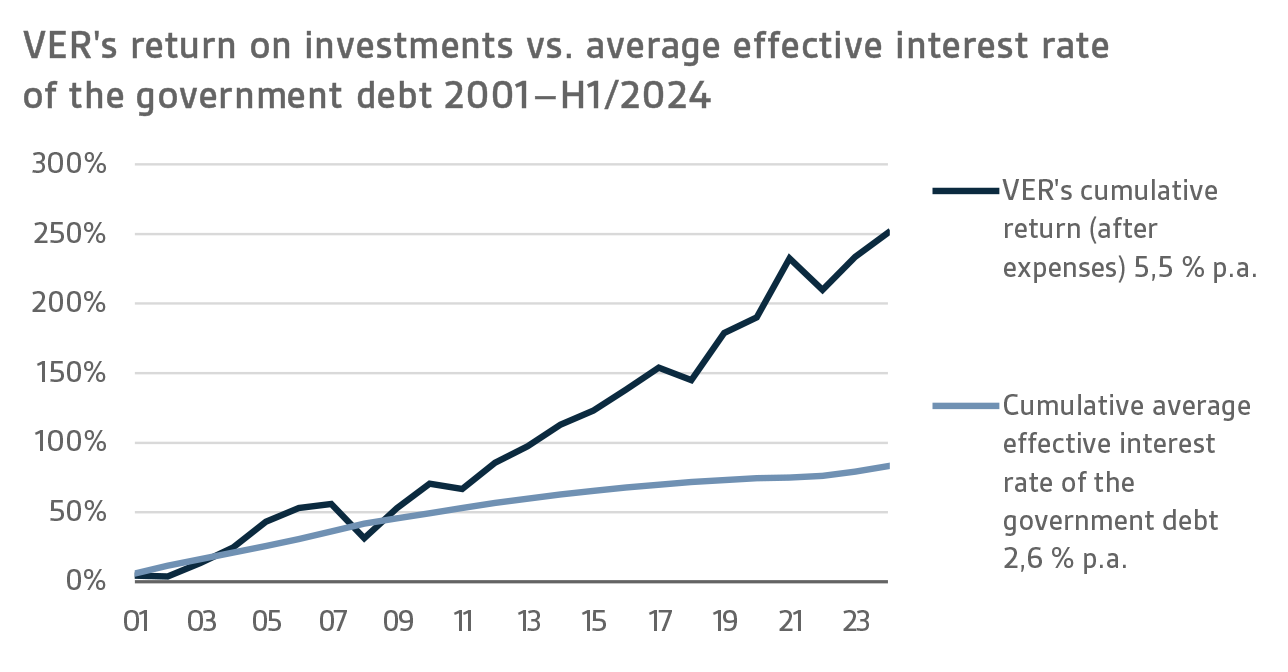
From the State’s point of view, it is pertinent to compare the return on investments with the cost of net government debt, because the funds accumulated in preparation for future pension expenditure can be deemed to reduce such debt. Over the past ten years, VER’s average annual rate of return has beaten the cost of net government debt by 4.2 percentage points. Since 2001, the total market-value returns earned by VER have exceeded the cumulative average cost of equivalent government debt by about EUR 11.3 billion over the same period.
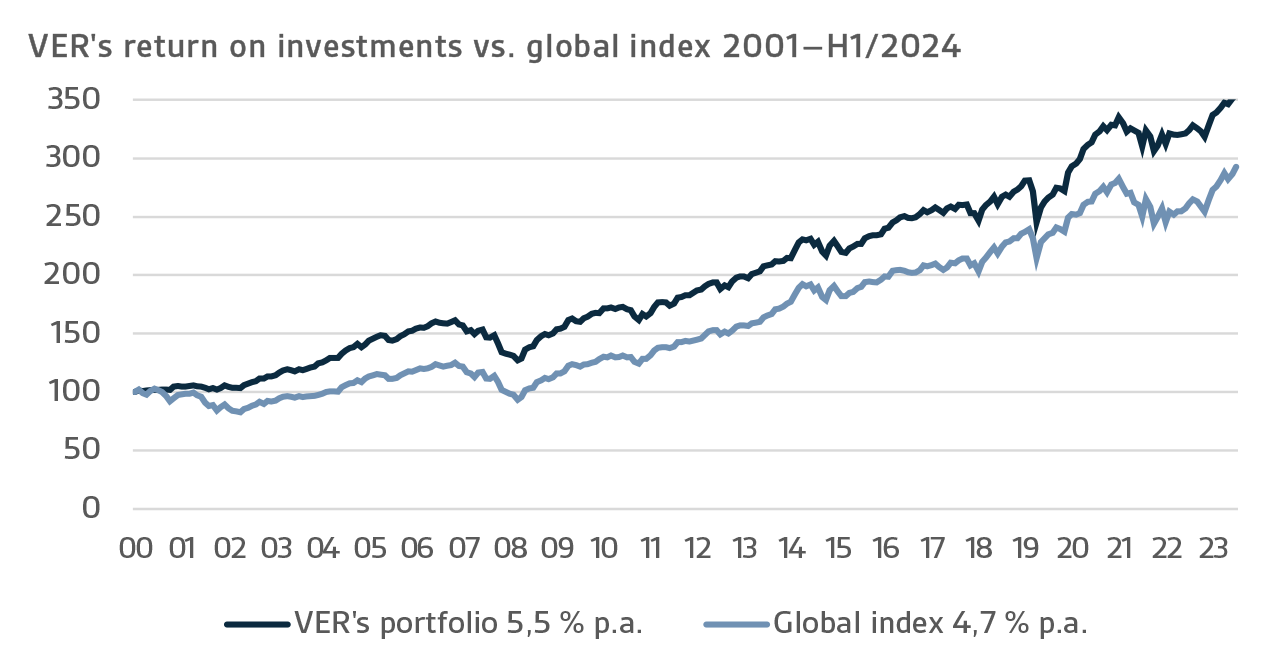
VER monitors long-term return relative to overall market developments by comparing the actual return with a global index, in which the weight of both equities and currency-hedged fixed income instruments is 50 per cent.
A CLOSER LOOK AT JANUARY–JUNE 2024
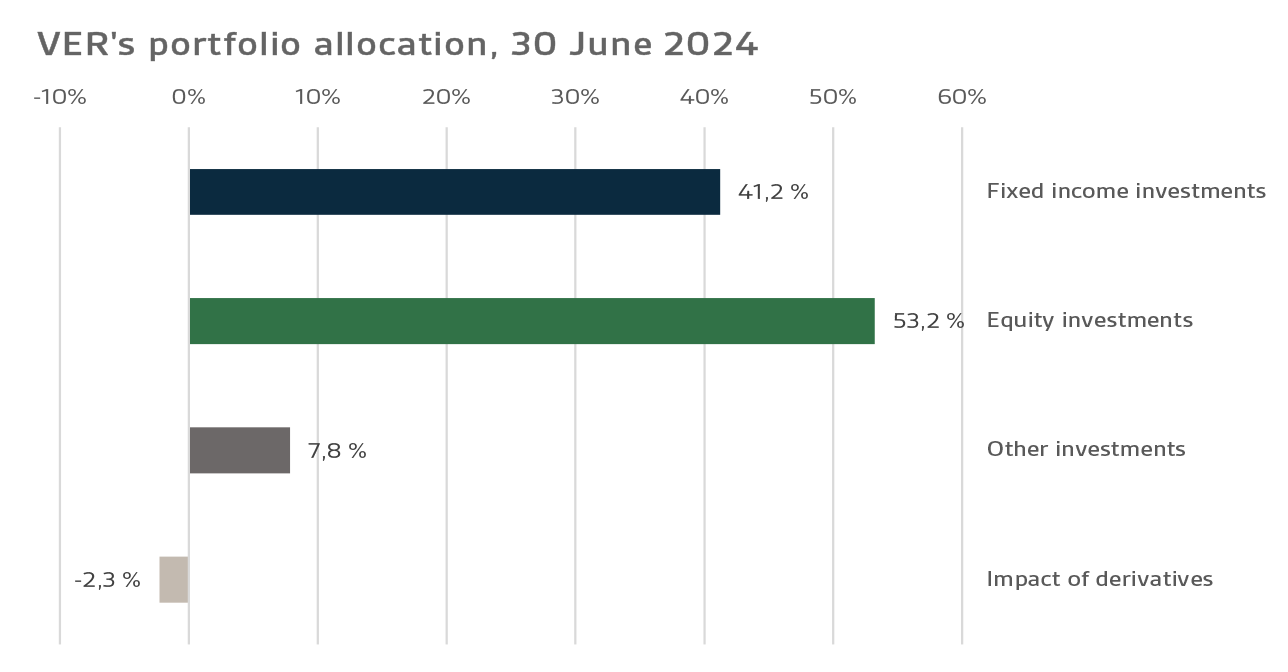
In accordance with the guidelines of the Ministry of Finance, VER’s investments are divided into fixed income instruments, equities and other investments. At the end of June, fixed income investments accounted for 41.2 per cent, equities 53.2 per cent and other investments 7.8 per cent of the total. Of the large asset classes, liquid fixed income instruments generated a return of 0.9 per cent and listed equities 10.3 per cent during the first half of the year.
FIXED INCOME INVESTMENTS
Liquid fixed income investments
During the first half of the year, the return on liquid fixed income investments was 0.9 per cent.
The rise in government bond rates in the first quarter of the year was reversed in the second quarter, although there was a divergence in the communications and measures taken by the US Federal Reserve and the European Central Bank (ECB).
The ECB prepared the market for a future rate cut at its April meeting and implemented a 25-basis point cut in June, as expected, while at the same time revising up its inflation forecasts for 2024 and 2025. Moreover, the ECB gave no indication of its future interest rate policy, signalling that future decisions depend entirely on the economic data to be published.
For its part, the FED gave no hint of the timing of the first interest rate cut in the first half of the year. The June interest rate indications for this year suggested only one rate cut of 25 basis points, down from the previous estimate of three. The FED cited domestic price pressures and the uncertainties regarding the inflation outlook and stressed that interest rate decisions depend on future economic data.
Risk premiums on corporate bonds widened to levels seen at the start of the year in mid-June, following unscheduled parliamentary elections in France, after hitting their narrowest levels of the year in May.
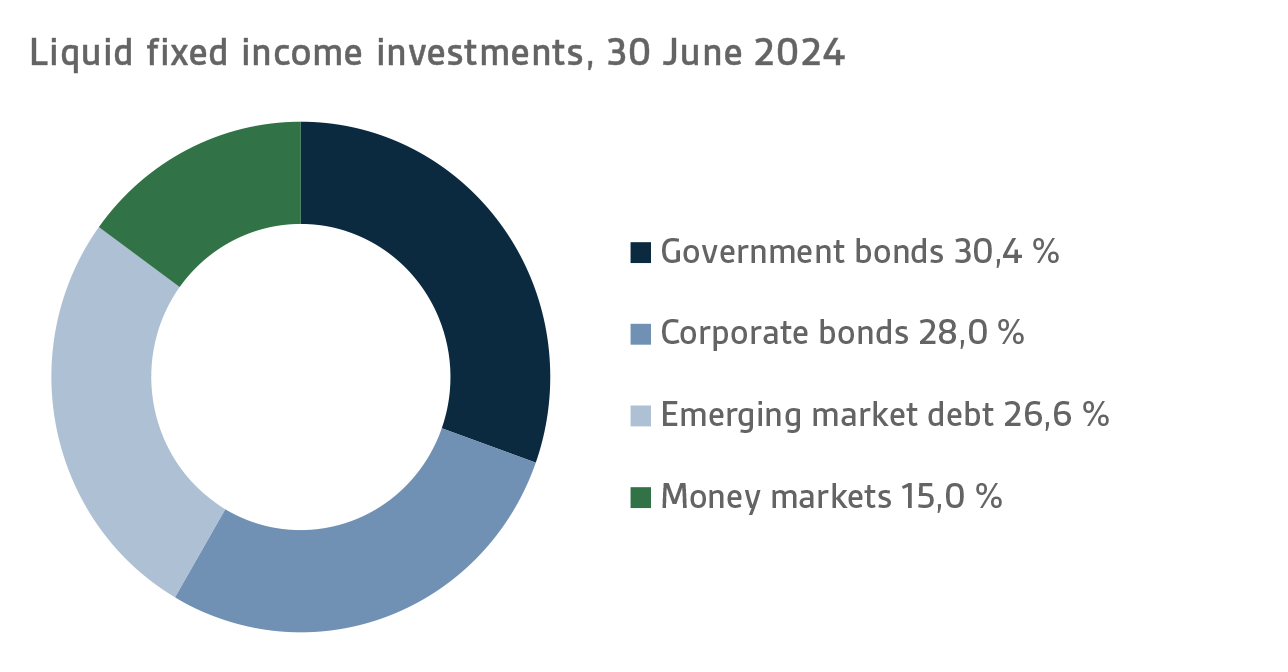
Of VER's liquid fixed income investments, the best returns were generated by lower-rated corporate bonds, while money market investments and investments in emerging debt markets also put in a sound performance.
Other fixed income investments
Other fixed income investments include investments in private credit funds and direct lending to companies.
The return on other fixed income investments was 2.7 per cent. The private credit funds generated 3.5 per cent.
The current market environment has been favourable for these funds. Rising interest rates and the declining role of banks as corporate financiers, particularly in Europe, have improved fund return expectations and increased the opportunities for potential investments. At the same time, however, the private equity transaction market was rather quiet in early 2024, which of course had an impact on the number of potential investments available to credit funds. So far, the amount of uncalled capital in private credit funds has been well below that of private equity funds, which has allowed credit managers to select the best investments and also kept competition less intense.
EQUITIES
Listed equities
During the first half of the year, the return on listed equities was 10.3 per cent.
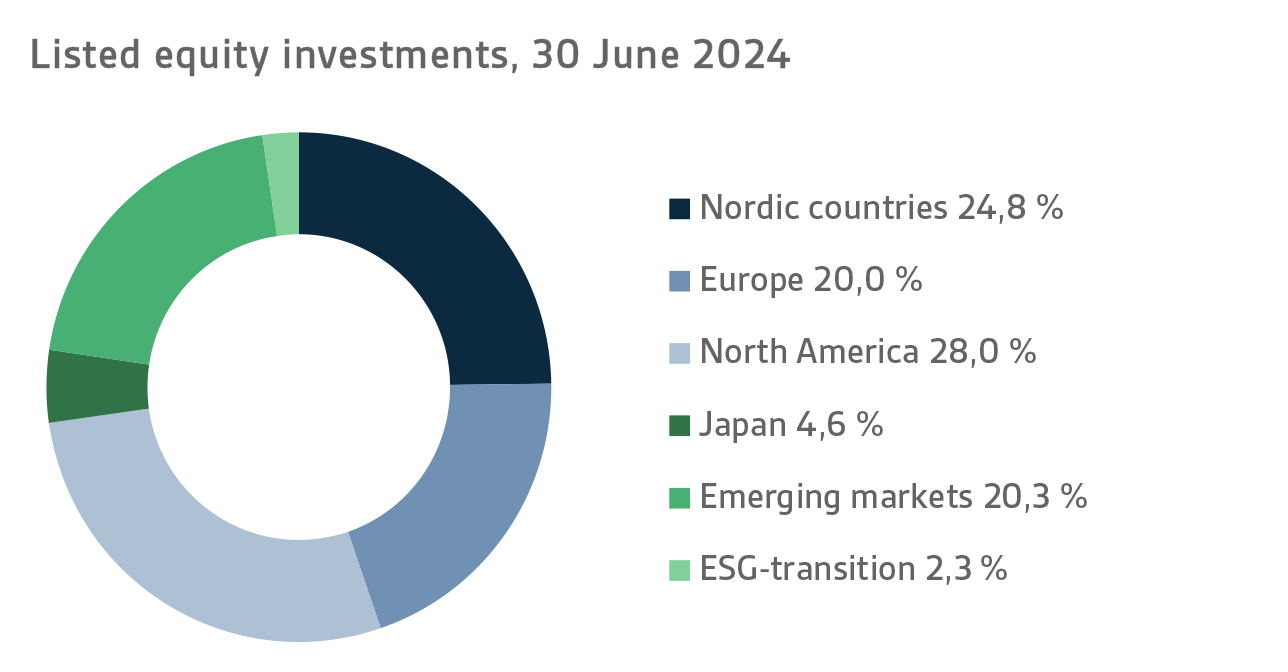
The mood in the global stock market during the first half of 2024 was largely positive. The markets continued to thrive on the familiar themes, and the relatively high interest rates did not seem to dampen the equity investors’ optimism. As in the past, the equity markets were driven by the United States, with AI-related companies in particular showing robust growth. In Europe too, stock markets were mostly buoyant. However, the outcome of the June European elections, and the ensuing political situation in France, caused widespread nervousness among investors. Of VER’s listed equity investments, the best performance was put in by investments in the North American stock markets, where most of the returns were generated by US technology companies. The least successful in the reporting period was the Nordic Countries sub-portfolio, in which returns on Finnish stocks in particular performed lamely due to the weakness of the Helsinki Stock Exchange.
Small-cap companies continued to underperform large companies across the board in the period under review, although a small recovery was noticeable, especially in the second quarter of the year. The poorer performance of small companies is largely explained by the extended profit streak of mega-cap companies around the world, especially in the United States. As a result, the weight of the United States in world indices has already risen well above 60 per cent, leaving all other geographical regions far behind. Earnings growth forecasts are high, especially in the technology sector in the United States. Investors have been happy with the results reported to date, and so growth continues. The latter half of 2024 is shaping up to become quite interesting when companies report on their financial performance and near-term prospects. Few disappointments are expected.
Other equity investments
VER’s other equity investments include investments in private equity funds, infrastructure and unlisted equities.
Private equity investments returned 5.3 per cent, infrastructure funds 3.7 per cent and unlisted equities 1.4 per cent.
With regard to private equity, the first half of 2024 was spent waiting for the transaction market to take off. However, corporate valuations have risen, partly driven by positive stock market developments. No major problems have so far been detected in the portfolio companies, although rising interest costs are feared to have an adverse impact on their financial position. Some signs suggesting a recovery of the transaction market are visible, and a gradual improvement is expected towards the end of the year. A few successful exits were executed in VER’s portfolio, although their total number remains modest.
In infr
astructure investments, rising interest rates have had a relatively slight negative impact on returns. Companies have succeeded in passing on the increased costs to retail prices and cushioning the negative effects of rising interest rates through interest rate hedging. Corporate valuations have also remained high. The funds’ fundraising market picked up slightly during the first half of the year relative to 2023, but it remains below the levels experienced in previous years. Investor interest is still evident in riskier value-add strategies, where returns are based more on an increase in value than dividend cash flows.
OTHER INVESTMENTS
VER’s other investments include investments in real estate investment trusts, hedge funds and systematic strategies.
The return on investments in unlisted real estate trusts was -4.5 per cent.
Due to rising interest rates, property values fell significantly throughout 2023. Market sentiment appears to have improved slightly in the course of the year, but a more significant change would require further falls in market interest rates. In some sectors, such as logistics, property values are estimated to have bottomed out. Some funds ended the first half of the year with positive returns, boosted by rental cash flow. An increase in property values is not yet imminent.
Hedge funds and systematic strategies returned 5.9% in the first half of the year.
In terms of returns, the first half of 2024 was excellent for hedge funds. The robust performance in the first quarter, across almost all investment styles in the portfolio, continued in the second quarter. An exceptionally good performance was put in by quantitative funds. The equity-focused funds added to the portfolio this year also delivered sound returns, especially in June. The most modest returns among investment styles were generated by macro funds, which found it hardest to gain insight into the interest rate and commodity markets.
The return on systematic strategies was negative during the first half of the year, but sound returns were achieved on other derivative positions, such as foreign exchange and credit derivatives.
STATE PENSION EXPENDITURE, VER’S TRANSFERS TO THE GOVERNMENT BUDGET, PENSION CONTRIBUTION INCOME AND FUNDING RATIO
The role of the State Pension Fund in equalising the government’s pension expenditure continues to grow. In 2023, the State’s pension expenditure totalled over EUR 5.3 billion while the 2024 budget foresees an expenditure of nearly EUR 5.6 billion. As VER contributes 41 per cent towards these expenses to the government budget, the transfer to the 2024 budget will amount to over EUR 2.3 billion.
By the end of June, VER had transferred EUR 1.1 billion to the government budget. Over the same period, VER’s pension contribution income totalled EUR 0.9 billion. The pension contribution income matched the forecast. VER’s net pension contribution income has now turned permanently negative, meaning that clearly more money is transferred from VER to the government budget than VER receives in pension contribution income. This gap between income and budget transfers will continue to grow year on year and slow down the growth of the Fund.
The Act on the State Pension Fund was amended in spring 2022. As part of this amendment, VER’s contribution to the government budget was increased as of 2024. Consequently, VER’s budget transfers will be gradually increased from the current 41 per cent to 45 per cent during 2024–2028. If the funding ratio exceeds 25 per cent for two consecutive calendar years, an additional transfer of three percentage points will be made to the government budget. Given VER’s growing role in offsetting government pension expenditure and the increase in negative net transfers, VER’s funding ratio is expected to fall in the coming years.
|
KEYFIGURES
|
|
|
|
|
30.6.2024
|
31.12.2023
|
30.6.2023
|
|
Investments, MEUR (market value)
|
23 630
|
22 803
|
22 128
|
|
Fixed income investments
|
9 743
|
9 180
|
8 863
|
|
Equity investments
|
12 574
|
12 150
|
11 626
|
|
Other investments
|
1 851
|
1 824
|
1 847
|
|
Impact of derivatives
|
-538
|
-351
|
-209
|
|
|
|
|
|
Breakdown of the investment portfolio
|
|
|
|
|
Fixed income investments
|
41,2 %
|
40,3 %
|
40,1 %
|
|
Equity investments
|
53,2 %
|
53,3 %
|
52,5 %
|
|
Other investments
|
7,8 %
|
8,0 %
|
8,3 %
|
|
Impact of derivatives
|
-2,3 %
|
-1,5 %
|
-0,9 %
|
|
|
|
|
|
1.1.–30.6.2024
|
1.1.–31.12.2023
|
1.1.–30.6.2023
|
|
Return on investment
|
5,1 %
|
7,7 %
|
3,7 %
|
|
Fixed income investments
|
|
|
|
|
Liquid fixed income investments
|
0,9 %
|
6,9 %
|
2,7 %
|
|
Private Credit funds
|
3,5 %
|
8,5 %
|
1,7 %
|
|
Return on investment
|
-1,9 %
|
4,9 %
|
2,8 %
|
|
Equity investments
|
|
|
|
|
Listed equity investments
|
10,3 %
|
11,3 %
|
6,2 %
|
|
Private Equity investments
|
5,3 %
|
5,0 %
|
2,2 %
|
|
Infrastructure funds
|
3,7 %
|
6,8 %
|
3,1 %
|
|
Unlisted equity investments
|
1,4 %
|
6,0 %
|
4,7 %
|
|
Other investments
|
|
|
|
|
Unlisted Real Estate funds
|
-4,5 %
|
-6,8 %
|
-1,1 %
|
|
Hedge funds and systematic strategies
|
5,9 %
|
3,2 %
|
-0,6 %
|
|
|
|
|
|
Pension contribution income, MEUR
|
882
|
1 679
|
862
|
|
Transfer to state budget, MEUR
|
1 143
|
2 116
|
1 063
|
|
Net contribution income, MEUR
|
-261
|
-437
|
-201
|
|
Pension liability, BnEUR
|
|
101
|
|
|
Funding ratio, %
|
|
22,7 %
|
|
Additional information: CEO Timo Löyttyniemi, firstname.lastname@ver.fi, tel. +358 (0)295 201 210
Established in 1990, the State Pension Fund of Finland (VER) is an off-budget fund through which the State prepares to finance future pensions and equalise pension expenditure. VER is an investment organisation responsible for investing the State’s pension assets professionally. At the end of June 2024, the market value of the Fund’s investment portfolio stood at EUR 23.6 billion.
All figures presented in this interim report are preliminary and unaudited.